Low-latency APIs over your BigQuery datasets


Some companies use DataFlow and BigQuery to collect and store analytical data.
But productising that data (making it available via APIs for products to consume and exploit) is pretty hard: BigQuery is just not designed (or priced) to withstand hundreds of requests per second. Here is how you can add Tinybird to the mix to productise that data.
In this post we show an example of how someone storing analytical data in BigQuery can use Tinybird to exploit the same data in real-time, with low-latency and hundreds of requests per second.
And all of it using the Google Cloud Platform tooling they are familiar with.
BigQuery and Tinybird
Acme.co, a B2B2C company that offers payment services globally wants to provide their enterprise customers with a real-time view of all their transactions so that they can:
- Reduce costs in exchange rates while operating in different currencies in real-time.
- Reduce fraud and re-issue invoices by reconciling payments.
- Keep track of business expenses and income.
- Increase revenue by providing better segmented payments.
To accomplish that, they are building an operational analytics dashboard where they will see among other things:
- Top recipients
- Top countries
- Evolution of payments
- Amount invoiced vs pending to pay
And all of the above with the ability to filter by any arbitrary date range, understand evolution of transactions by comparing date ranges or adjust for different currencies and exchange rates.
Their data is in BigQuery, but they need Tinybird to build that kind of real-time data product. That’s how they can expose part of that data via APIs, as soon as it becomes available and with fast query times. This is how they do it.
Before Tinybird
Acme co. collects their payments data in two ways:
- Through data streams, where they have several consumers doing transformations. One of them is a DataFlow pipeline that removes PII (personally identifiable information) from each invoice and writes batches in BigQuery.
- They do bulk upserts in BigQuery after their reconciliation processes which run weekly.
Their data model looks like this:

Three dimensions tables (agents, clients and recipients) and an events table (invoices) which contains millions of rows per month, with a nested type we’ll show you how to process with Tinybird.
Integrating Tinybird with BigQuery
First thing is creating the Data Sources in a Tinybird account. The schemas are in this data project, and creating the datasources is as simple as running these commands locally with the Tinybird CLI and some sample CSVs:
To create the data sources and ingest some sample data:
Then, there are two ingestion scenarios:
Bulk upload from BigQuery to Tinybird
They do this for dimension tables and the first bulk ingestion for the invoices table. It runs directly from the CLI:
And just like that, you’ll have a copy of those particular columns in Tinybird.
Streaming ingestion using Google DataFlow
This Apache Beam connector, will stream a PCollection directly into Tinybird, into the invoices Data Source.
The DataFlow pipeline collects batches of 15 seconds or 10000 elements and streams them to the Tinybird’s API. You can run the DataFlow pipeline following the instructions in this repo. But it’s something like this:
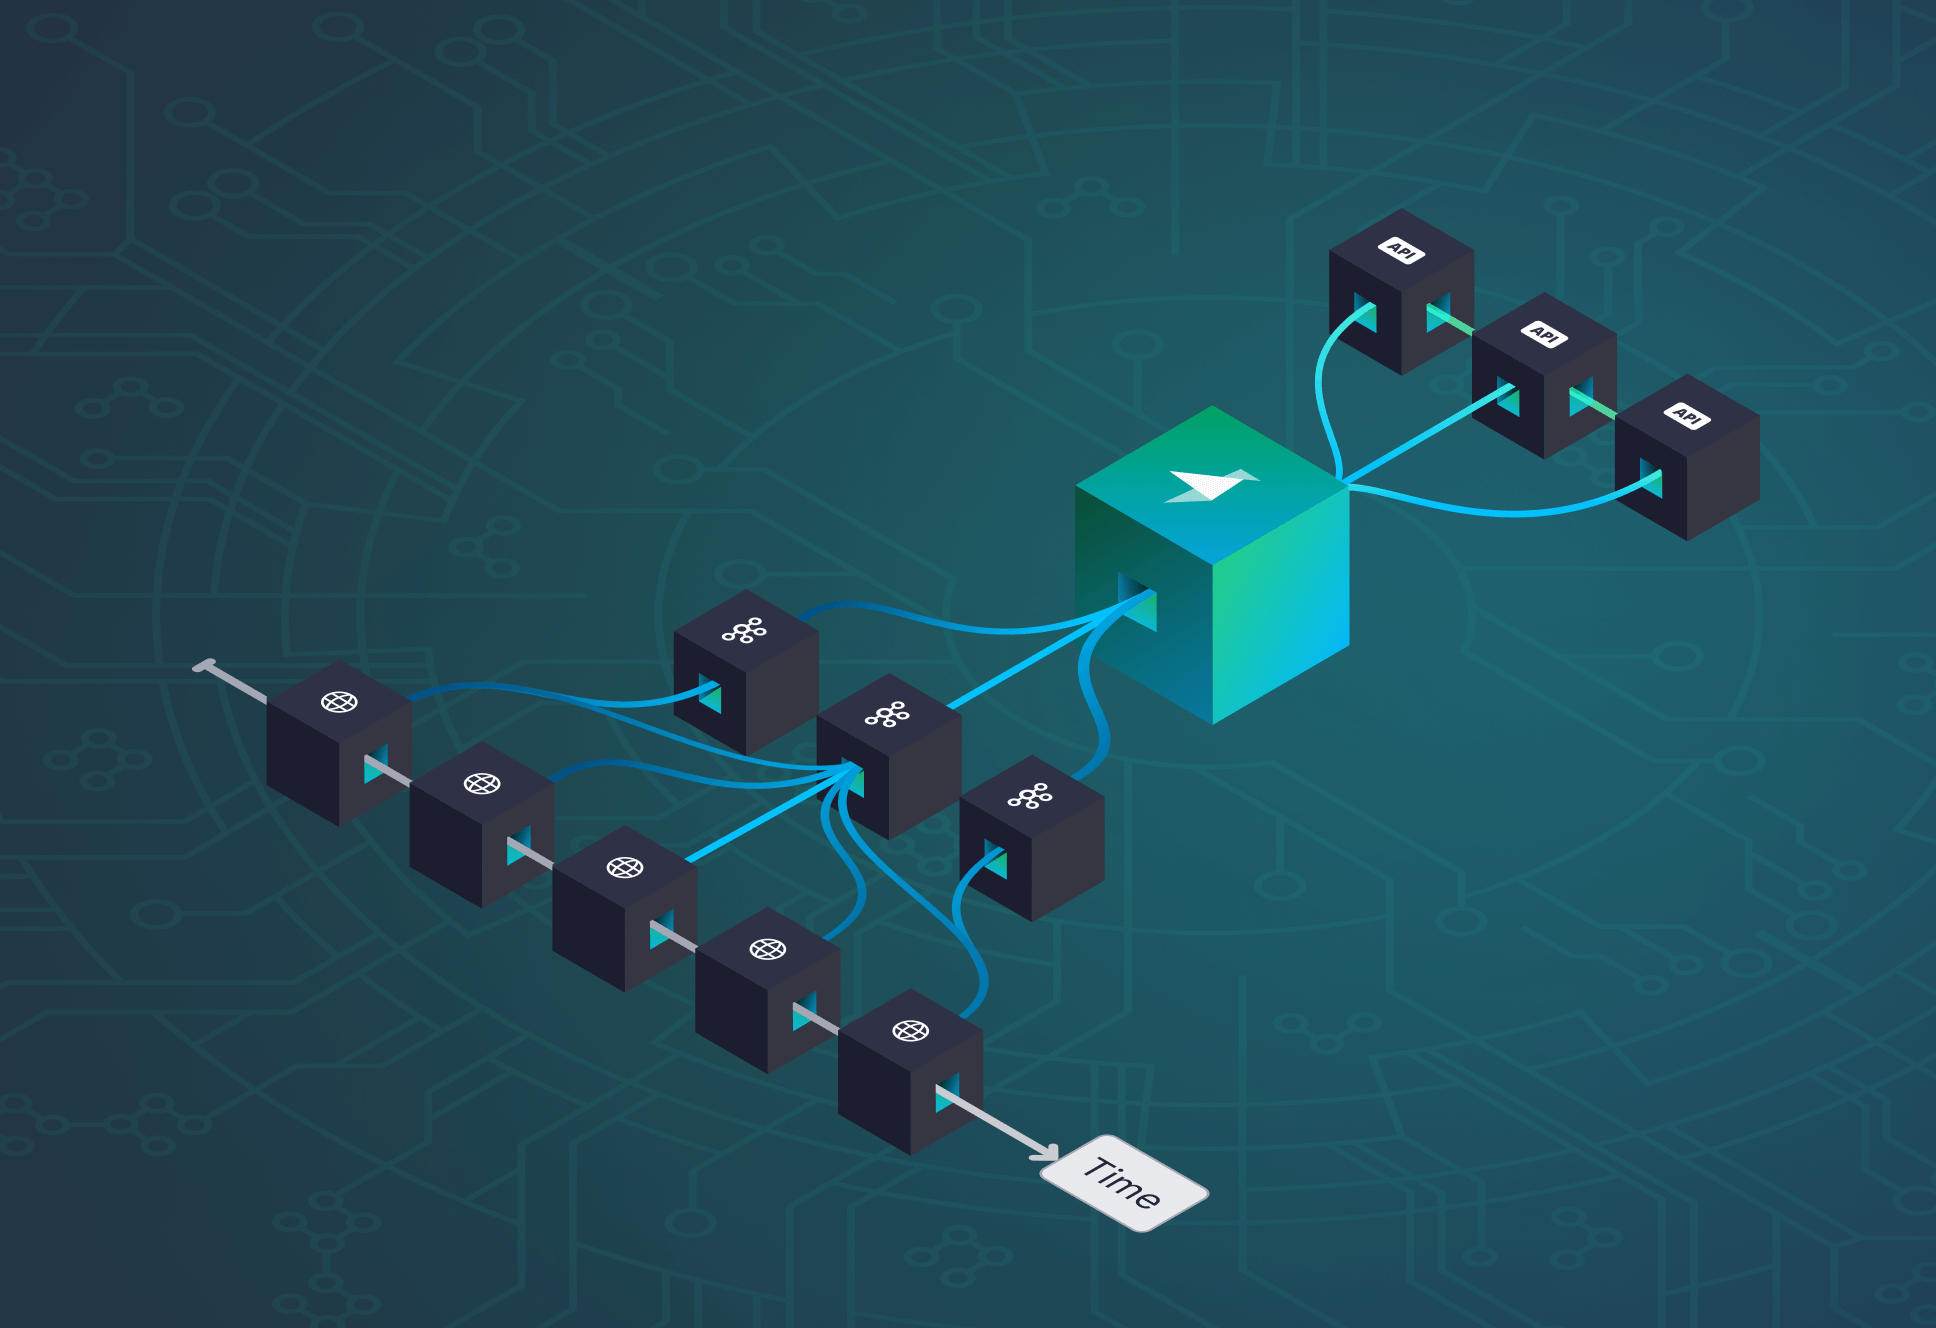
The whole workflow looks like this:
The ingestion rate is about a hundred invoices per second, making a total of about 200 million records per month.

Transforming data on the fly for real-time analytics
Time for some stream processing in Tinybird. One of the real-time data analytics principles is “the less data you read the faster your API endpoints”. This is specially important when you deal with huge amounts of data.
That’s why they use materialized views to do some transformations and pre-aggregations on the fly over the invoices table as data comes in:
- Convert the amount to €, since is the currency used for analysis.
- Unnest the {% code-line %}added_payments{% code-line-end %} JSON object to calculate the invoices payed vs pending to pay. This is done with JSON and ARRAY functions
- Leverage ClickHouse engines to pre-aggregate data per days, so endpoints are blazing fast.
Publishing the API endpoints
The endpoints are defined in this folder and they are published from the CLI in a few seconds:
On every push to production they get automatic regression tests but they’ve also configured their own integrations tests with fixtures.
The real-time publication layer for your BigQuery Datasets
Once the endpoints are published they use the Auth API to create custom dashboards for each client.
They have a public documentation for their data product, so the frontend team in the company can integrate them right away. They decided to use Tableau with Web components for the end users:

And Vega as a testing tool to validate data quality in real-time:

Have questions? Sign-up below to get notified of our upcoming live webinar and start doing real-time analytics out of your BigQuery datasets.